Reports and analytics
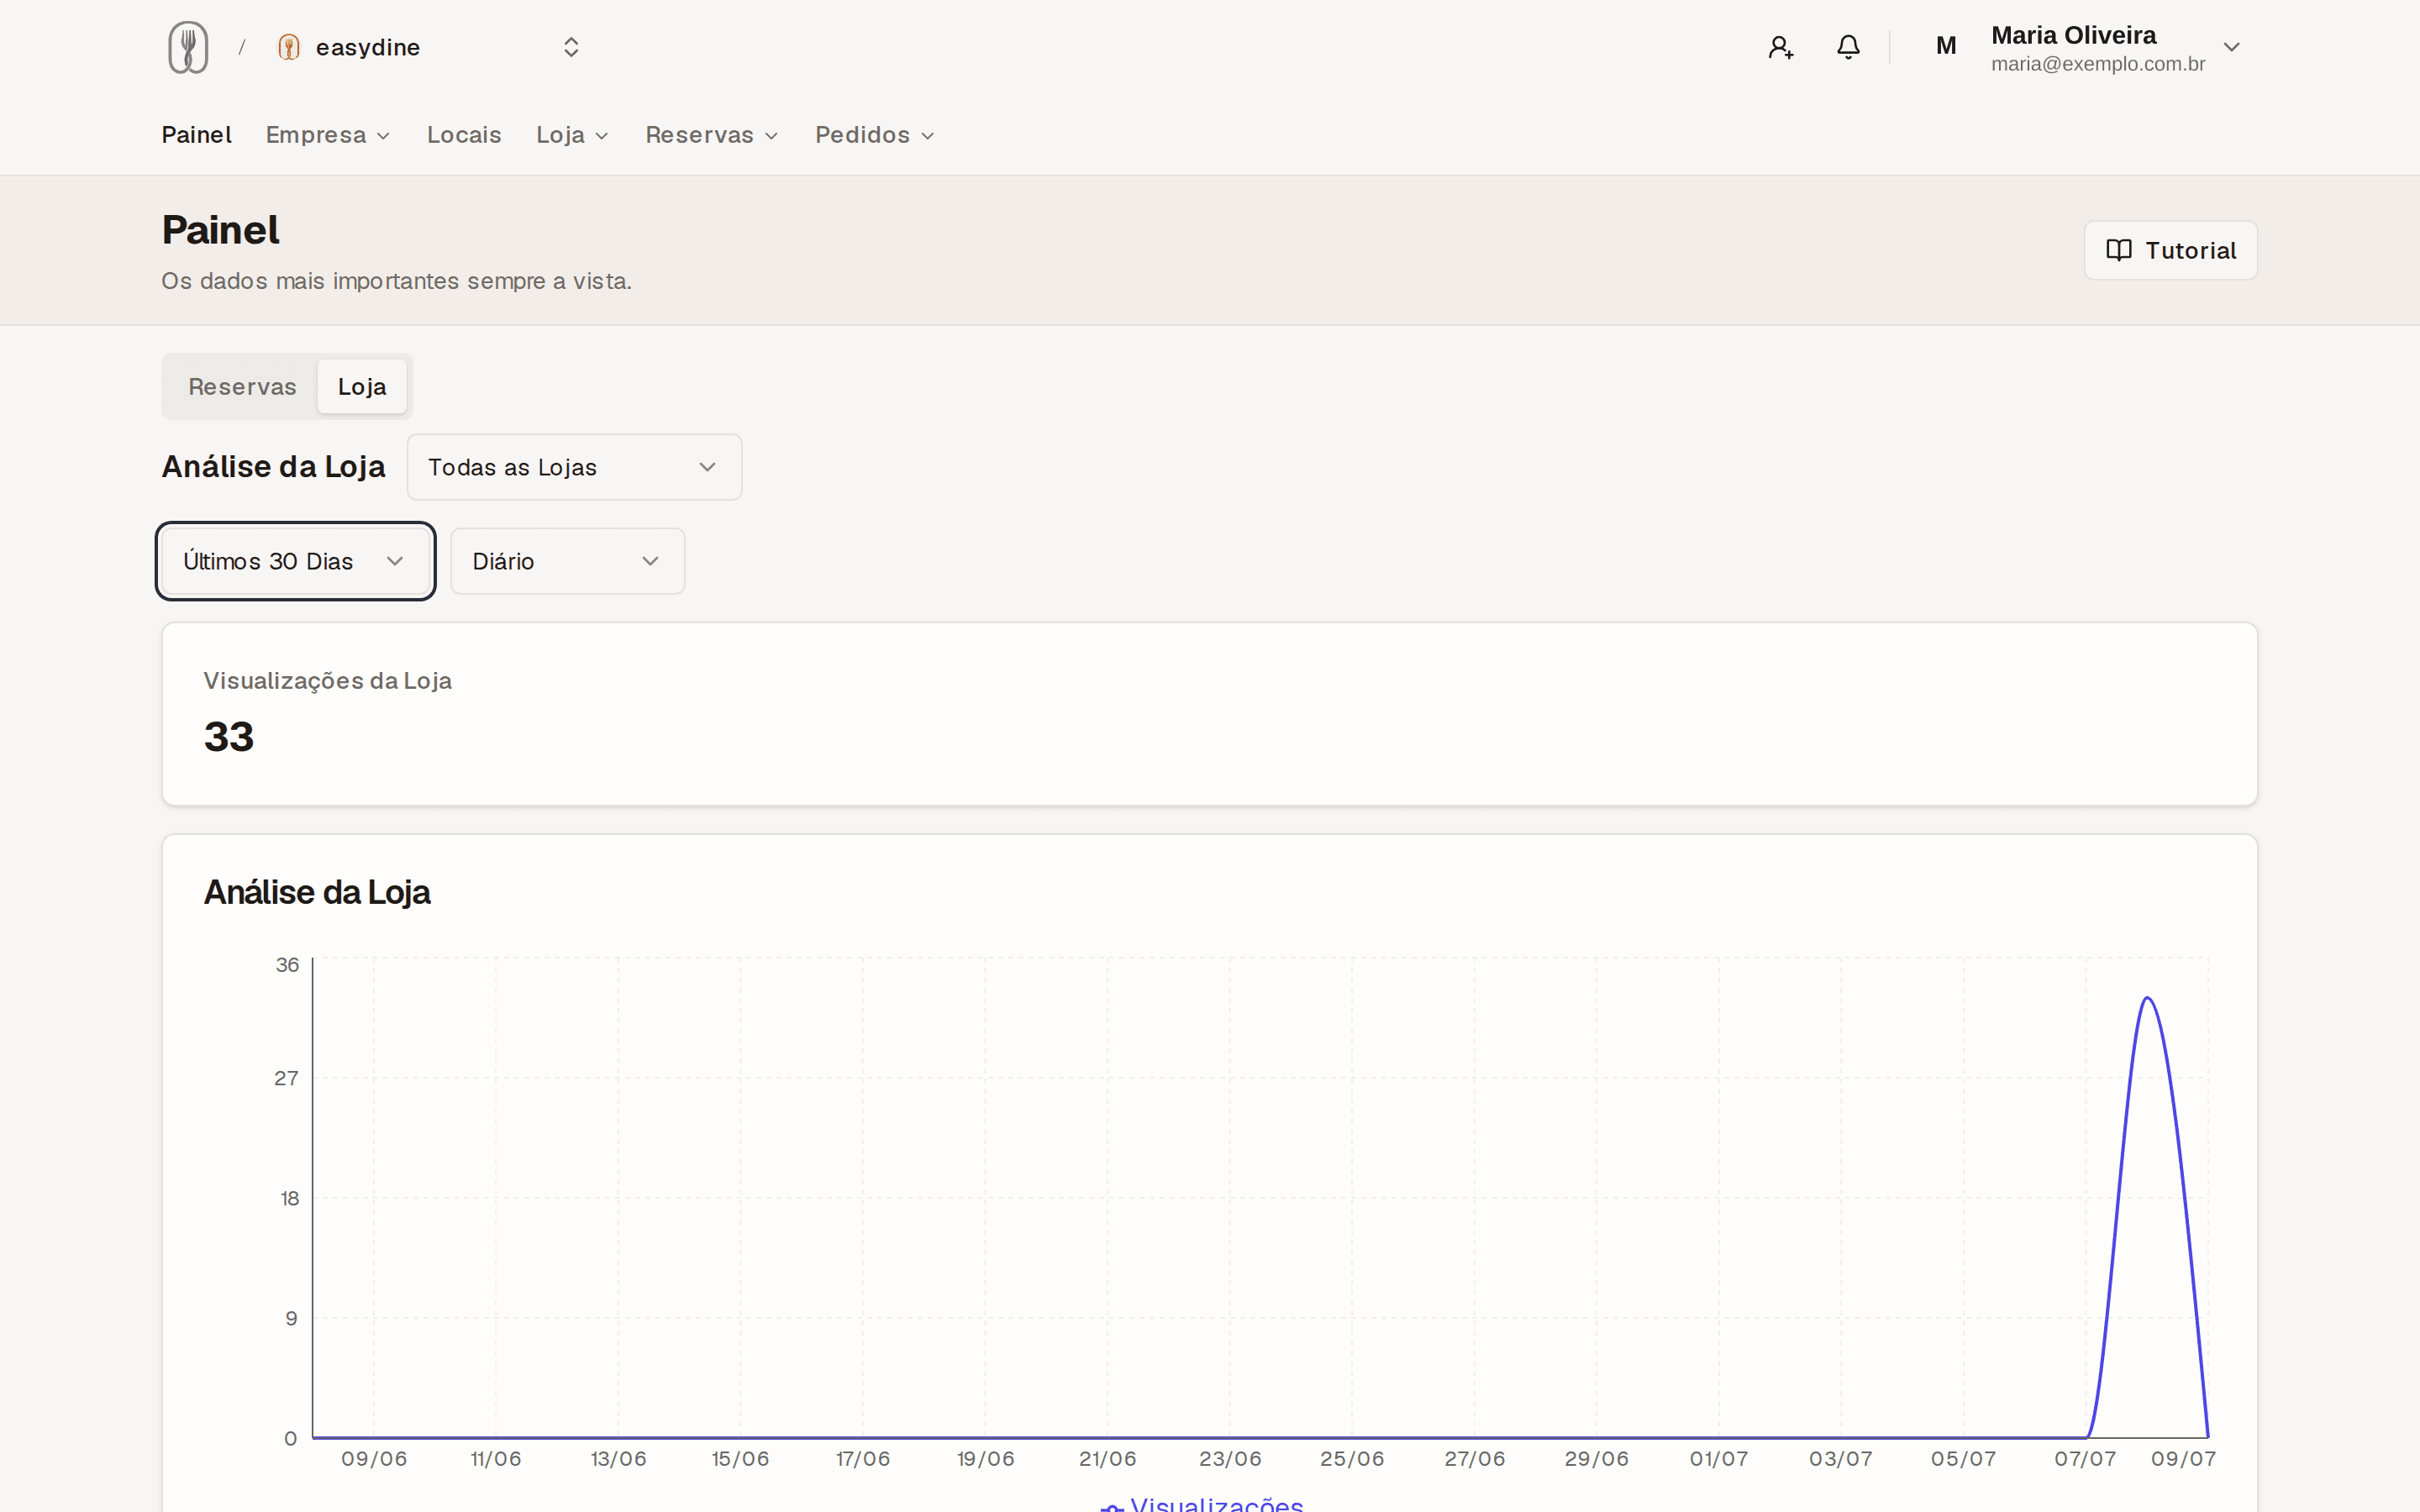
How many people visited your online store this month? How many reservations turned into customers at the table? easydine's reports answer these questions with simple numbers, right in the dashboard. No spreadsheet required.
Reports are included in the Profissional and Completo plans. See the details in Plans.
What you learn
| Metric | What it's for |
|---|---|
| Online store visits | How many people opened your site in the period. Good for checking whether that Instagram post actually brought people in. |
| Reservation funnel | Created, completed, canceled, and no-shows: how many came in and how many turned into seated customers. |
| Average party size | Do your customers come as couples or in groups? That changes how you set up your dining room. |
Store funnel: where people give up
Visits count who arrived. The funnel counts how far each person got — the difference between "few people came" and "people came and gave up halfway".
| Step | What it means |
|---|---|
| Menu opened | Somebody opened a menu on your online store. |
| Item in cart | They picked at least one item. |
| Checkout started | They reached the checkout screen. |
| PIX chosen | They asked to pay with PIX. |
| Card chosen | They asked to pay by card. |
| Orders placed | They finished. |
Each step shows how many people reached it, what share that is of the top of the funnel, and how many carried on from the step before. The biggest gap between two rows is where to work first: a large drop between the menu and the cart is usually price or photos; between checkout and the order placed it is usually the delivery fee, the payment method or the minimum order.
The two payment methods are shown indented: they are not a step between checkout and the order, they are a fork. They answer "are people giving up, or is the card simply not going through?" — if plenty of people choose card and few finish, the problem is not your menu. Under each method, when there are any, you see how many attempts failed.
The funnel uses the same period, the same store filter and the same time-of-day filters as the rest of the screen.
The first three steps are counted in the visitor's browser, so they stop counting when someone refuses measurement in the cookie notice or runs a blocker. The order is counted on the server, at the moment it is created — which is why the last step can sit above the one before it in some periods.
Orders taken at the counter, at a table or from the panel are not included: they never went through the storefront, and counting them would invent a conversion that did not happen.
The two payment methods only appear on orders paid online. Someone paying on delivery, at the table or at the counter never reaches that screen, so "Orders placed" can sit above them. And someone who tries one method, cannot complete it and switches to the other is counted in both — so the two can add up to more than 100%. Both readings are deliberate: hiding either one would hide exactly the case you want to see.
Nothing counted here identifies who bought. The payment method is recorded as a number — "this many people chose PIX" — with no name, no e-mail, no amount and no card details of any kind.
Filtering by day and by time of day
Everything that decides the period sits behind one button, which shows what is currently on screen ("Last 7 days", "Yesterday · 18:00–23:00"). Open it and the ready-made periods — today, yesterday, 7, 30 and 90 days — are large buttons: one click applies and closes. Below them is the calendar, for picking the first and the last day, and the time-of-day window — yesterday from 18:00 to 23:00, for instance. The calendar and the times only take effect when you press Apply, so the screen does not keep reloading while you are still choosing.
The end time is not included: "up to 23:00" ends at 22:59, so consecutive windows never count the same minute twice. Times move in 15-minute steps.
Next to the period is the chart resolution, and it follows the period you picked: over a single day you see the store's activity in 15-minute steps, over a week or two hour by hour, and over longer periods every 12 hours, by day, by week or by month. Only the options that make sense for the period are offered — 15-minute steps across 90 days would be thousands of points, and a chart like that cannot be read. Prefer a different one? Just pick it: your choice stands for as long as it fits the period.
There is also an "only during opening hours" filter, which uses each store's configured hours — each store's own, never one set shared across all of them. With it on, a store with no configured hours is left out of the whole period, and the screen tells you how many were, so an empty chart is never mistaken for a quiet week.
A window that crosses midnight (22:00 to 02:00, say) works: each hour is counted on the day it actually happened, so Tuesday's small hours show up on Tuesday.
The funnel covers up to 90 days per query. Periods older than that are not available — the screen says so instead of drawing a flat chart you would read as lack of business.
The dashboard remembers what you picked — the open tab, the period, the chart resolution, the time-of-day window, the store and the chart lines — and comes back to it next time, in this same browser. If you always work one store from 18:00 to 23:00, you do not have to set the filter up again every day. The memory belongs to the browser: on another computer, or after clearing browser data, the screen goes back to its defaults.
Sales report
Orders → Sales report has the till figures, not only the visit ones:
| Figure | What it answers |
|---|---|
| Revenue | What came in over the period, discounts deducted and delivery fees included. |
| Average ticket | What an order is worth on average. It rises when the add-on suggestion works. |
| Cancelled orders | Counted apart — a cancellation never enters revenue or the average ticket. |
| Revenue by day, weekday and hour | Where the movement actually is. This is what decides staffing and promo hours. |
| Top products | The ten that earned most over the period, with quantities. |
| New and returning customers | How many bought for the first time, and how many came back. |
Filter by period, by location and by order type (on site or delivery). The figures always describe the filter on screen — changing the page does not change the total.
An order you moved to a cancellation status stays out of revenue, out of the average ticket and out of the top products, and shows up only in the cancelled count. Mark which statuses mean a cancellation in the status-flow editor: the names are yours, so the system cannot guess that "Refused" is a cancellation.
Taking it to a spreadsheet or to paper
- Download CSV builds the file on the server, with the same figures as the screen and in the convention your spreadsheet expects.
- Download PDF uses the browser's own printing: choose "Save as PDF" in the dialog. It comes out exactly like what you are looking at, without the filters and the buttons.
Order totals on the Orders screen
The Orders screen shows, above the list, the total for what is filtered: how many orders, how much revenue, the average ticket and how many were cancelled. It answers "how was Saturday" without opening the report — and it moves with the date, location, type and status filters.
Pick the period and the location
Compare the last 7, 30, or 90 days to see both the impact of this week's promotion and the quarter's trend. If you have more than one store or location, filter to see each one on its own and find out which unit needs more attention.
How to use it day to day
- Plan your staff schedule. If reservations pile up on Fridays and Saturdays, that's when to reinforce the team.
- Run promotions on slow days. A stretch with few visits and reservations is the right moment for a discount code.
- Reduce no-shows. If the number is high, adjust the late-arrival grace period and the minimum notice in your booking configurations.
Ten minutes a week with the 7-day report shows where your business is heading, before the problem shows up in your register.